
A new study from the Canada’s national statistics agency shows that Canada is blessed with a wealth of water resources and that Canadians are doing more to conserve freshwater. The report released today offers the most up-to-date and comprehensive assessment of the depth of renewable freshwater resources for each of Canada’s 25 drainage regions, as well as the latest summary of industrial and household use.
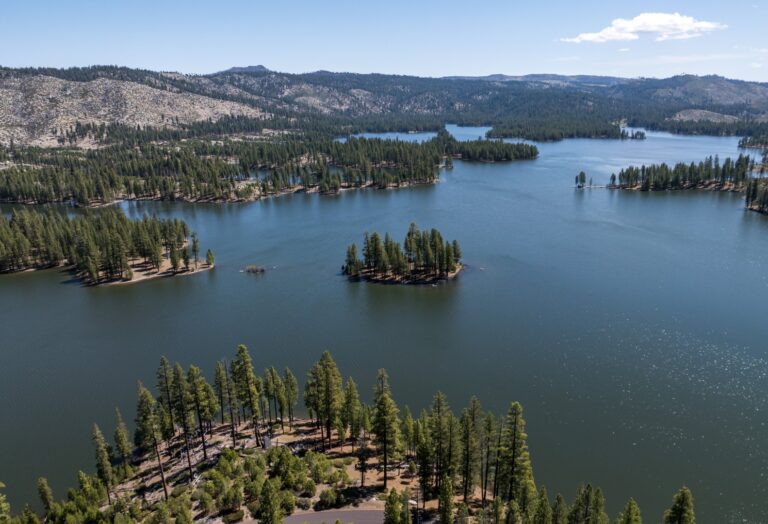
Water availability in Canada
Statistics Canada reported, “Canada’s average annual water yield—an estimate of the country’s supply of renewable freshwater—is so large that there is enough water to approximate a one-minute flow over Niagara Falls for each and every Canadian.” The Human Activity and the Environment report noted that the annual water yield averaged 3,478 km3 from 1971 to 2013. This yield represents, the third largest renewable freshwater supply worldwide and the second largest amount per capita among developed countries—on average, 104,000 m3 for every single Canadian.
In term of water variability, the findings confirm that these yields vary greatly from year to year, by season, and across different regions of the country with the greatest yield framing coastal regions:
- The Pacific Coastal drainage region in British Columbia had the highest water yield per unit area in the country.
- The lowest yields were found in the Missouri, Assiniboine–Red, South Saskatchewan and North Saskatchewan drainage regions in the Prairies.
- Water yields are generally highest in spring and early summer. The median monthly water yield for southern Canada from 1971 to 2013 peaked at 218 km3 in May, but dropped to 76 km3 in August, with a low of 50 km3 in February.
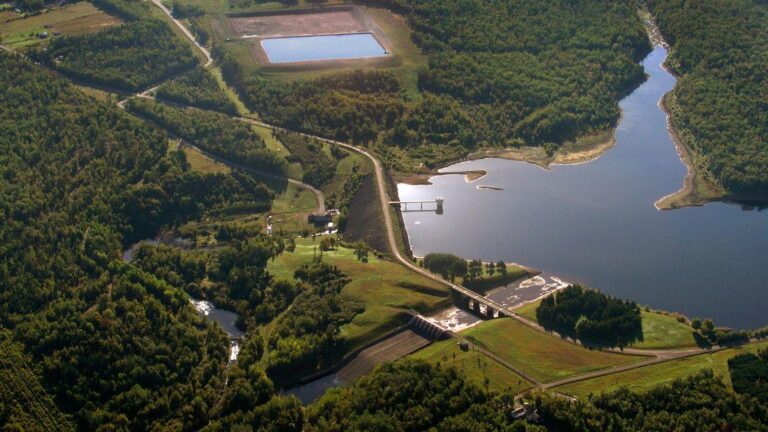
Average annual runoff in Canada, 1971 to 2013

The annual water yield in southern Canada has fluctuated over time, from a high of 1,544 km3 in 1974 to a low of 1,165 km3 in 1987. In 2012, the total volume of freshwater flows was 1,294 km3.
Chart 1 
Annual water yield, southern Canada, 1971 to 2012

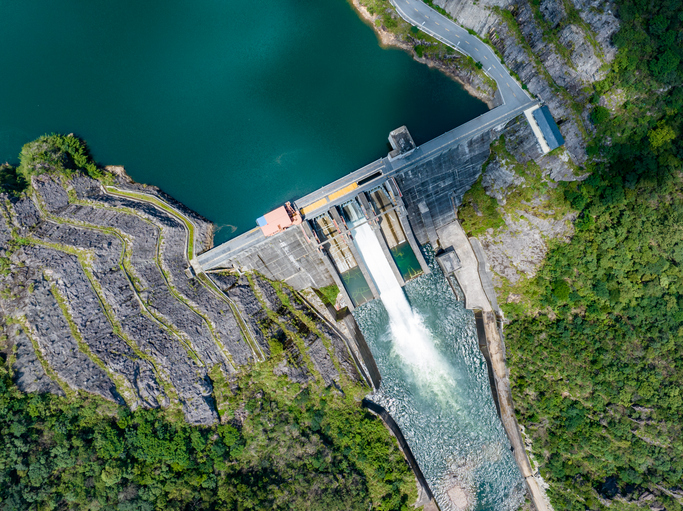
Water use in Canada
The top water user based on the 2013 data were:
- electric power generation, transmission and distribution (responsible for 68 per cent)
- manufacturing (10 per cent),
- households (9 per cent),
- agriculture (5 per cent)
- mining and oil and gas extraction (3 per cent)
The report noted that total household water use was down 16 per cent compared with 2005 data. On a per capita basis, water use has fallen from approximately 330 litres each day in 2005 to 250 litres each day in 2013, in part due to improvements in the water efficiency of toilets and appliances. However, if one considers the water use related to the production of goods and services that are used daily within households, the finding show that households were responsible for 53 per cent of total water use in 2013, followed by the production of goods and services for export at 30 per cent.

While the report is not intended to project future water availability or use, it noted that Canada’s freshwater supply is affected by ongoing changes in precipitation and temperature patterns associated with climate change. The finding point out that “average annual temperature increased 2.6°C in the Mackenzie and 1.9°C in the Northwestern Forest climate regions in northern Canada from 1948 to 2015, causing some permafrost thawing and thereby modifying the hydrology of these areas.”
The full report is available on Statistics Canada’s website.


Counting water use, consumption and disappearance is tricky business. Water used for electrical generation is not removed from the water system but may impact other users. Moving water from groundwater to a surface source may impact local hydrology for other users. Uses that degrade the quality of water, or make it unavailable to other users particularly in the summer are of more consequence. Also, uses that essentially remove water from a watershed need to be monitored closely of impacts on natural ecosystems.
Thanks for your comments, Bruce!
You make some good points. Interestingly, another story we posted, , on March 22nd addresses some of these ideas from a global perspective. Scientists have found that the measurement practices used to determine water scarcity are giving distorted impressions of scarcity at local or regional levels and, thus, globally.
Another point that you might be interested in is the work that P.E.I. is doing now in implementing its Water Act. There’s a strong emphasis on locality in designing water management strategy.